• Moderators, please send me a PM if you are unable to access mod permissions. Thanks, Habsy.

Advanced Stats Thread

The reason the lazy stats guys ignore special teams is because they're more variable from year to year - thus, in their minds, not a reliable indicator of True Talent.


Which is based on them, as you've eluded to, looking from the team level downward instead of the player level upward. What was the difference inbetween the Leaf PK in 11/12 & 12/13...a healthy Reimer & Jay McClement. Personnel changed...that's the indicator.
 
yep, but they literally have no way of actually measuring the impact of roster changes like that.
 
Problem is, those positive future prediction correlations they see at the team level kinda breakdown at the individual level, as far as I know.

Mirtle skirts the roster-changes issue by claiming that Corsi/Fenwick is more useful for in-season regressions, rather than season to season projections.

Of course, these leafs seem to want to put even that backtracking explanation to the test.
 
Saw this on hftards. Kinda cool.

Last.png
 
Would be better if they cleared up some of the noise. I see names like Justin Schultz, Bouillion, Oduya, Vlasic, Chris Phillips, etc clogging that up.
 
Would be better if they cleared up some of the noise. I see names like Justin Schultz, Bouillion, Oduya, Vlasic, Chris Phillips, etc clogging that up.

Yeah, definitely true. You can see that Phaneuf is a clear stand out in terms of QOC and defensive zone starts though.
 
HFtards is just painful to read. You know that's the shitstorm that's gonna go down when Dion finally signs, whatever the number.
 
Pardon the question: do people keep stats for Pass attempts, Pass completions, Turnovers. Also, how long the pass travelled.

Basically, view every player as a mini-QB when they have the puck on their stick.

And as a mini running back (how many feet does he gain inside the blue line where it's tough to manoeuvre)
 
Thats some great work. See that is what these guys need to do. Instead of just trying to morph the stats to fit with your conclusion, actually break down the numbers and see what they tell you.

Its some interesting stuff. Nothing so far that is surprising (goalies are better at stoping clean shots than shots in transition, deflections, and second chances). But the guy is going to test out more interesting hypotheses moving forward.
 
Pardon the question: do people keep stats for Pass attempts, Pass completions, Turnovers. Also, how long the pass travelled.

Basically, view every player as a mini-QB when they have the puck on their stick.

And as a mini running back (how many feet does he gain inside the blue line where it's tough to manoeuvre)

i know a guy who was doing this for an eastern conference team but they ran into a few problems:

(1) the puck is moved so frequently and so quickly that it was really time consuming (and therefore expensive) to track; and

(2) the results weren't showing them much.
 
Question: When was the last time you saw Phaneuf get beat off the rush?

one interesting thing that might be worth tracking that i've been thinking about is how many times in a game does a defenseman face his own goalie?

it means you were either beat off the rush, are getting abused on the cycle or are scrambling in front of your own net.

and, i specifically thought about it because of how infrequently phaneuf is caught facing his own net.
 
i know a guy who was doing this for an eastern conference team but they ran into a few problems:

(1) the puck is moved so frequently and so quickly that it was really time consuming (and therefore expensive) to track; and

(2) the results weren't showing them much.

Thanks.
 
http://blog.philbirnbaum.com/2013/10/corsi-shot-quality-and-toronto-maple_30.html

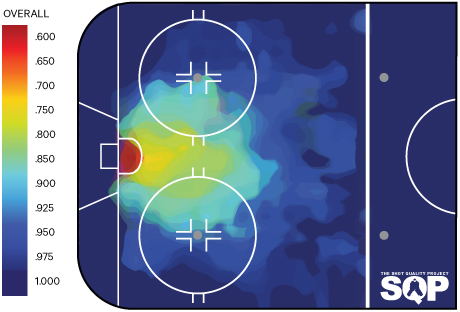
My last two posts argued that there might be an inverse relationship between shot quality and shot quantity -- or, in other words, between Corsi and shooting percentage (SH%).

Most hockey analysts disagreed with me. Which is fair enough; so far, the only evidence I've really put forward is the negative correlation, the last two years, between Corsi percentage and shooting percentage. In each of the seasons 2011-12 and 2012-13, in even-strength tie-game situations, the team correlation was -0.24. Before that, it was close to zero.

I spent the last week searching for other evidence, and I think I finally found something.

---------

If shooting percentage in tie games is just luck -- or mostly just luck -- you should expect no correlation between shooting percentage this year, and shooting percentage next year. And that's pretty much what you see in the data. From 2007-08 to 2011-12, the team "that-season-to-next-season" correlation was only about 0.03 -- virtually zero. (All "Corsi" numbers in this post are even-strength tie-game situations only.)

Doing the same thing to predict goal percentage from goal percentage (the percentage of goals in your games that are yours), I found a stronger relationship, a correlation of 0.27.

And, as the hockey analytics community has shown, this year's Corsi is even better for predicting next year's goal percentage. That correlation came out to 0.40.

So: Corsi is an excellent predictor, and shooting percentage appears to be just random. So, you'd expect that if you try to predict next year's goals from this year's Corsi, knowing this year's shooting percentage shouldn't be much of a help. Right?

Well, apparently, that's *not* right. I ran that regression, and, surprisingly, shooting percentage was significant, both statistically and practically. The SH% variable had a p-value of .09, and the actual effect was large.

It turned out that every point of shooting percentage was worth 0.83 points of goals next year. So, if the league shooting percentage was 7.5%, but you had 8.5%, then, all things being equal, you should score 50.83% of goals next year.......

 
that's actually a fascinating article. (remember, this Birnbaum guy is a well respected baseball sabermatrician who has only started to play with the hockey metrics in recent weeks).

another very juicy part of it:

Here's another, similar, bit of evidence. In a recent post (hat tip: Tango), garret9 points to some correlation numbers from JLikens. Those look at early season numbers to try to predict future team wins in the same season.

In 2007-08, tie-score Corsi predicts the near future much better than goals. For instance, if you use the first 40 games of Corsi to predict the next 40 games of winning percentage, the correlation is .408. But if you use the first 40 games of goals, the correlation is only .312.

In 2008-09, Corsi is still better, but less so. The corresponding r values are .569 for Corsi, and .488 for goals.

But, in 2009-10, the difference disappears. Now, Corsi and goals are almost the same, at .419 and .409, respectively. As you move later in the season, the order reverses. If you try to predict 30 games from 50, Corsi and goals actually "tie" at .396. Predicting the last 20 games from the first 60, (or 10 from 70), goals "wins" outright.

That probably wouldn't happen if shooting percentage wasn't measuring something real, would it?

I recommend reading the whole thing, though.
 
his conclusion:

Anyway, even without fully understanding what's going on, I think all this constitutes enough evidence that we need to take the "shot quality matters" hypothesis seriously. As we've seen:

1. Since 2011-12, there's a negative correlation between Corsi and SH%;

2. Since 2010-11, a high shooting percentage this year is an indicator of more goals next year;

3. In 2009-10, goals suddenly became as good a within-season predictor as Corsi;

4. In 2009-10 and (especially) 2010-11, outshooting your opponent became an indicator of losing the game, rather than winning.

I guess it's possible that what we're just looking at is random luck, and that the same stroke of random luck created all four phenomena. But ... really? I think that, at this point, it seems that some kind of "not luck" explanation is more reasonable.

Much more plausible than luck, IMO, is that I've just done something wrong, or that I haven't interpreted the evidence correctly, or that there are other arguments that counterbalance what I've said here, or that I just screwed up the data somehow.

And, again, I'm not saying that this is *proof* that shot quality and Corsi are related, just that it's good enough evidence that you have to at least consider it. Seriously, doesn't it seem like there might be something there?
 
“I guess we're not a team that just shoots from anywhere like some of these teams,” said Kadri, who had one shot and one assist in 20 minutes against the Flames.

“The Pittsburgh's and the Chicago's, even Calgary, any opportunity they have they're just throwing it at the net and then seeing what happens. A lot of times that's not a bad thing. But for us, we wait for our odd-man rushes or if we outman someone in front of the net to get good scoring chances usually we're putting them in.”
 
Leafs Advanced Stats Through 15 Games:
(Min. 5 Games Played)

Blueline:

Corsi Relative Quality of Comp:
1. Phaneuf: +3.4
2. Gunnarsson: +3.2
3. Franson: +1.3
4. Rielly: +1.0
5. Ranger: -1.3
6. Gardiner: -1.7

Corsi Relative:
1. Gardiner: +10.4
2. Ranger: +8.9
3. Phaneuf: -1.7
4. Gunnarsson: -2.2
5. Franson: -10.3
6. Rielly: -10.8


Forwards

Corsi Relative Quality of Comp:
1. Clarkson: +3.5
2. Bolland: +2.7
3. Raymond: +2.3
4. Kessel: +2.0
5. Van Riemsdyk: +1.9
6. Lupul: +1.3
7. Leivo: +1.3
8. Bozak: +1.2
9. Kadri: +0.8
10. Bodie: -0.3
11. McClement: -0.6
12. McLaren: -0.9
13. Smith: -1.6
14. Broll: -1.9
15. Ashton: -3.5
16. Orr: -4.1

Corsi Relative:
1. Clarkson: +40.6
2. Bolland: +12.0
3. Ashton: +10.4
4. Lupul: +6.5
5. Leivo: +5.7
6. Kadri: +0.6
7. Broll: +0.1
8. Orr: -1.6
9. McClement: -1.4
10. Raymond: -2.5
11. Kessel: -3.0
12. Bozak: 3.5
13. van Riemsdyk: -5.6
14. Smith: -14.2
15. Bodie: -16.9
16. McLaren: -21.5
 
Last edited:
Back
Top